
Bill,
Sent you a PM about a different topic. Thanks.
Global warming my butt...
Moderator: Available
You are correct, I should have mentioned plutonium since I mentioned fusion. However as you say uranium is being used and plutonium is not, so the effect that we are using up our finite supply of uranium still stands. The 40 year estimate for remaing uranium supplies comes from a chapter on resources in a human geography textbook. It also mentioned the potential of plutonium but like you discounted it due to resistance to using it. The author of that texbook has what I feel is one of the better definitions of a resource (and I paraphrase since I do not have the book at hand): A naturally occurring material that is useful to humans, economically feasable to use, and socially acceptable to use.RACastanet wrote: That is not at all correct. Uranium fission reactors can produce plutonium fuel as a byproduct. In fact, the fast breeder reactor makes more fuel than it consumes. Imagine that. However, plutonium has such a bad name the few FBRs in the world have been shut down. No, there is no shortage of fissionable fuel. FBRs are just too politically incorrect.
There are fossils on Antarctica that depict it's once tropical past as well. However the reason is continental drift. Antarctica and the locales you mention have not always been at their current latitudes/longitudes. As the land masses have wandered across the face of Earth, so to speak, their respective environments changed. That particular evidence aside though, your central concept that at times Earth's average temperature appears to have been warmer than it is today is correct. I'll see if I can find a nice chart of the history of global temperature that I can provide a link to. There is one I use for class, but it is on an overhead.RACastanet wrote: Let us go back a hundred million years or so, when giant reptiles ruled the earth. These animal required temperate climates. And where in the US do we find the fossils of T rex and the like? In Montana, the Dakotas, even Canada and other less than tropical locals. It must have been a tad warmer up north in those days. Global warming? Also, at that time there was no northern polar ice cap, it was an open ocean year round.
Rich
Glenn
-
RACastanet

- Posts: 3744
- Joined: Thu Mar 11, 1999 6:01 am
- Location: Richmond, VA

I wonder when this will stop seeming farfetched...
http://www.envsci.rutgers.edu/~veron/moon.pdf
I don't see it mentioned in this article, but when I spoke with Criswell a few years ago he indicated that he thought the system could be made energy neutral by creating areas of increased albedo.
I don't see it mentioned in this article, but when I spoke with Criswell a few years ago he indicated that he thought the system could be made energy neutral by creating areas of increased albedo.
Mike
Here is an interesting example of the spatial variability of temperature change, particularly over geologically short time periods:
http://www.cotf.edu/ete/modules/climate/GCremote3.html
In particular is the map of the U.S. about 1/3rd of the way down with this accompanying text:
http://www.cotf.edu/ete/modules/climate/GCremote3.html
In particular is the map of the U.S. about 1/3rd of the way down with this accompanying text:
Scientists estimate that mean global temperatures have increased by 0.5 to 1.0 °F (0.3 to 0.6 °C) in the last 100 years. Note that this is an increase in the "mean global" temperature. "Mean global temperature" refers to the average of all of the temperature changes from throughout the world. In reality, the temperature change has not been consistent across the planet. In fact, the temperature change has not been consistent across the United States (see map below). In the last 50 years, temperatures in the western United States have warmed. At the same time, temperatures in the eastern United States have cooled. The cooling in the southeastern United States may be due to excessive sulfates in the air. Sulfates can scatter the sun's light before it reaches the earth's surface. Without heat from the sun, the earth's surface will cool.
The map at the right displays temperature trends across the United States over the last 100 years. Red circles represent temperature increases, while blue circles represent temperature decreases. Large circles represent a 3°C change, medium circles represent a 2°C change, and small circles represent a 1°C change. Map courtesy of the United States Environmental Protection Agency.
Last edited by Glenn on Tue Mar 13, 2007 6:03 am, edited 1 time in total.
Glenn
As promised here is some examples of graphs of average global temperture, although they do not extend back to the time of dinosaurs. These come from this site:
http://www.seed.slb.com/en/scictr/watch ... change.htm
Time-scale is important. As I have mentioned before, short-term trends tend to be overshadowed by long-term trends.
The first one shows trends over the past 150 years and is representative of commonly used graphs to show recent warming. While it has good detail, the brief time period shown really limits its utility.

The second one is better because it shows trends over the past 2000 years, and indicates that the recent warming is both greater and more sudden than other changes during that time period. It indicates a correlation between the industrial age and global warming, but of course such a chart by itself cannot in any way tie the two together in a causal relationship.

The third one, which charts global average temperature over the past 425,000 years, highlights what Rich (and others) was getting at that there have been time periods with warmer global averages than exist today. The other nice aspect of a chart that covers this length of time is that it shows the ice age cycle that has been occurring during that time, and how our current global average temperature relates to it. There are 4 periods of ice age shown, each followed by a sudden increase in average temperature. That is more or less where we are now, in the peak after the last ice-age trough. But note that from this chart it appears the global temperature increase from the last ice-age may have already peaked and global temperature may have begun a downward trend, although on the other hand it could also still be ocilating and not headed perpetually downward yet. At any rate some of you may remember that as the collection of Antarctic ices cores started in the 1960s and these types of graphs began to be compiled from that data, in the early 1970s earth scientists were touting that Earth was headed into the next ice age. From this chart you can see why. It wasn't until the late 1970s that they had switched directions to concern about global warming. This switch coincided with looking beyond the charts to the mechanisms that drive the patterns displayed on the charts, and how we might be disrupting/enhancing those mechanisms.

http://www.seed.slb.com/en/scictr/watch ... change.htm
Time-scale is important. As I have mentioned before, short-term trends tend to be overshadowed by long-term trends.
The first one shows trends over the past 150 years and is representative of commonly used graphs to show recent warming. While it has good detail, the brief time period shown really limits its utility.
The second one is better because it shows trends over the past 2000 years, and indicates that the recent warming is both greater and more sudden than other changes during that time period. It indicates a correlation between the industrial age and global warming, but of course such a chart by itself cannot in any way tie the two together in a causal relationship.
The third one, which charts global average temperature over the past 425,000 years, highlights what Rich (and others) was getting at that there have been time periods with warmer global averages than exist today. The other nice aspect of a chart that covers this length of time is that it shows the ice age cycle that has been occurring during that time, and how our current global average temperature relates to it. There are 4 periods of ice age shown, each followed by a sudden increase in average temperature. That is more or less where we are now, in the peak after the last ice-age trough. But note that from this chart it appears the global temperature increase from the last ice-age may have already peaked and global temperature may have begun a downward trend, although on the other hand it could also still be ocilating and not headed perpetually downward yet. At any rate some of you may remember that as the collection of Antarctic ices cores started in the 1960s and these types of graphs began to be compiled from that data, in the early 1970s earth scientists were touting that Earth was headed into the next ice age. From this chart you can see why. It wasn't until the late 1970s that they had switched directions to concern about global warming. This switch coincided with looking beyond the charts to the mechanisms that drive the patterns displayed on the charts, and how we might be disrupting/enhancing those mechanisms.
Last edited by Glenn on Fri Jul 24, 2009 8:14 pm, edited 1 time in total.
Glenn
Here is another good source for charts of global temperature changes:
http://math.ucr.edu/home/baez/temperatu ... ml#4600Myr
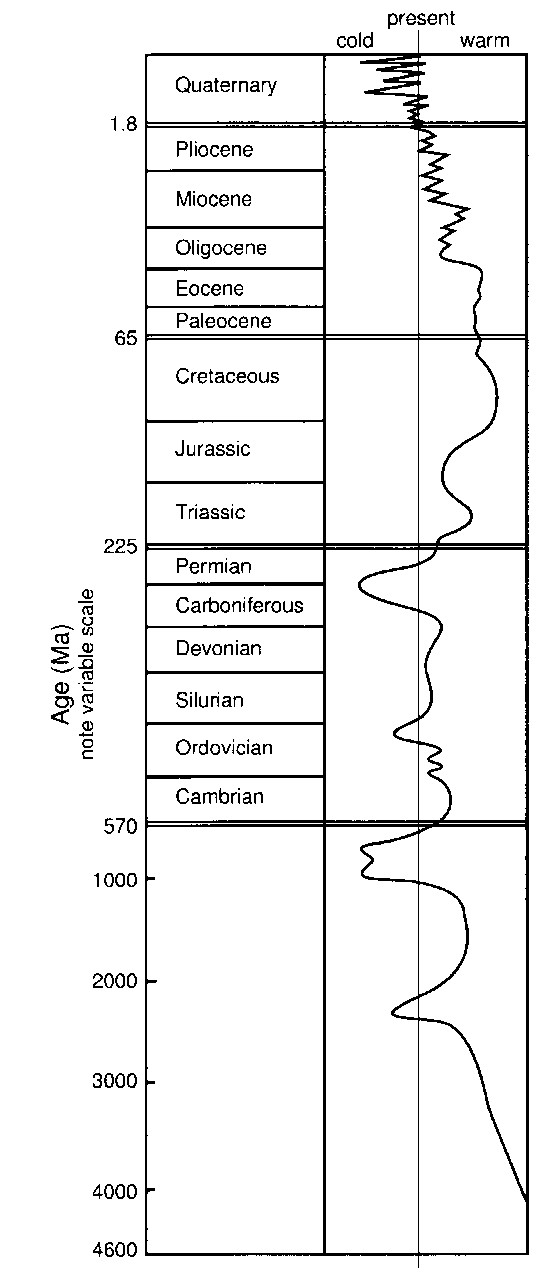
The only one I will draw attention to is the first one, which shows average global temperature over the past 4.6 billion years (with the present at the top). The preceding graph that covered 425,000 years only covers a very small portion of the top of this graph, within the Quaternary period. Note on this graph that during the time of the dinosaurs (Triassic, Jurassic, and Cretaceous periods) Earth was quite a bit warmer than today. It wasn't until the start of the Quaternary period that temperatures stayed at or below the present global average. Even with the scale not being constant along this graph and the fact that life only goes back about 570 million years of the 4.6 billion shown, it seems safe to say that most of the time life has exised on Earth the average temperature has been warmer than it is today.
http://math.ucr.edu/home/baez/temperatu ... ml#4600Myr
The only one I will draw attention to is the first one, which shows average global temperature over the past 4.6 billion years (with the present at the top). The preceding graph that covered 425,000 years only covers a very small portion of the top of this graph, within the Quaternary period. Note on this graph that during the time of the dinosaurs (Triassic, Jurassic, and Cretaceous periods) Earth was quite a bit warmer than today. It wasn't until the start of the Quaternary period that temperatures stayed at or below the present global average. Even with the scale not being constant along this graph and the fact that life only goes back about 570 million years of the 4.6 billion shown, it seems safe to say that most of the time life has exised on Earth the average temperature has been warmer than it is today.
Glenn
There's no "correct" equilibrium, per se. The planet could turn into a giant ice ball or an expansive desert and neither situation will be more correct in an objective sense. But from a human perspective those are pretty dire situations. Current science says global warming leads to things we don't like (coastal flooding, displacement of people whose arable land converts to desert, violent storms, etc.). On that basis, it makes sense to take steps to avoid things we don't like. If not, oh well, I'm sure New York's will make a lovely coral reef.So what was the state of affairs when the carbon used to be present as CO2 in the atmosphere? Are we bringing the earth out of or back into its correct equilibrium?
I disagree that those are the only possible scenarios. Heading down a path of mutually assured disaster just because we don't want someone else to get an economic advantage seems a little short-sighted. What can we do to push China towards greener policies? Trying to address that question is a better approach than assuming that the situation is hopeless, I think.So we have the following scenarios.
Do I have perfect solutions? No. I would tend to go down the road of economic alliances. China relies on trade like anyone else, and while they can trade with India or other countries that also show little interest in environmental sustainability, relations with the US/Europe are still very important to their well-being.
Alternative energy sources? Wind, water, sun, geothermal, nuclear? Lots of potential options that result in less CO2. At the moment these technologies are behind the curve, but that doesn't mean they're intrinsically doomed.Newsflash... Where's the electricity going to come from, dude? Try doing a little research and find out where those electrons come from that are in the wall waiting for you to use them.
In some sense maybe. Economics controls availability. I recently discovered that it's impossible to get a modern pair of basketball sneakers that are made domestically. So the only available option is shoes that have been shipped overseas. It's always possible to just do without, but at some point there has to be a limit. I'd happily pay a price premium for goods that fit my ethics, but in some cases it's just not possible. Often I just do without, but not always.What's your excuse, Justin? Did Big Business make you consume more energy than you should have?
I do what I can with the resources available to me. I bike instead of driving, I stopped using air conditioners, I avoid buying things that come with a lot of packaging. When I have enough money to buy a house I absolutely plan on outfitting it in an energy-efficient manner. Until then my options are somewhat limited in terms of what I can install.
The nice thing is that it's a largely reversible process. Plant metabolism fixates carbon.Furthermore... NOT GOOD ENOUGH. Carbon still goes from under the ground to the atmosphere. We're just delaying the inevitable. Then what???
-
RACastanet
- Posts: 3744
- Joined: Thu Mar 11, 1999 6:01 am
- Location: Richmond, VA
Yes it does. In fact, the higher concentration of carbon dioxide in the atmosphere is a boon to plant life. We can expect higher crop yields as the result of the increase in CO2. And, the increased plant population will increase the reduction of CO2 into O2.Plant metabolism fixates carbon.
Looks like nature has this in hand.
Glenn: Great job on the charts..
Thanks, Rich
Member of the world's premier gun club, the USMC!
There are many other factors in determining the rate at which plants will fixate carbon beyond how much carbon is available. The capacity of plants to absorb CO2 is not unlimited. If it were, then we wouldn't have rising levels of CO2, but we do. The available energy from the sun, water and total biomass are all rate limiters. If CO2 levels became depleted only then would plant-life benefit from increased emissions.RACastanet wrote:Looks like nature has this in hand.Plant metabolism fixates carbon.
Given, among other things, the ongoing clearing of rain forests, I would anticipate that the rate of fixation is currently going down, not up, all things considered.
-
RACastanet
- Posts: 3744
- Joined: Thu Mar 11, 1999 6:01 am
- Location: Richmond, VA
Environmental Effects of Increased Atmospheric Carbon Dioxide
• Abstract
• Summary
• Rise In Atmospheric Carbon Dioxide
• Atmospheric And Surface Temperatures
• The Global Warming Hypothesis
• Global Warming Evidence
• Sea Levels And Storms
• Fertilization Of Plants
• Discussion
• References
--------------------------------------------------------------------------------
Top Previous Next
Abstract
Click here to receive this document in PDF format.
Click here to view this a slide show version of the figures and graphs
ARTHUR B. ROBINSON, SALLIE L. BALIUNAS, WILLIE SOON, AND ZACHARY W. ROBINSON
Oregon Institute of Science and Medicine, 2251 Dick George Rd., Cave Junction, Oregon 97523 info@oism.org
George C. Marshall Institute, 1730 K St., NW, Ste 905, Washington, DC 20006 info@marshall.org January 1998
ABSTRACT
A review of the research literature concerning the environmental consequences of increased levels of atmospheric carbon dioxide leads to the conclusion that increases during the 20th Century have produced no deleterious effects upon global weather, climate, or temperature. Increased carbon dioxide has, however, markedly increased plant growth rates. Predictions of harmful climatic effects due to future increases in minor greenhouse gases like CO2 are in error and do not conform to current experimental knowledge.
http://www.oism.org/pproject/s33p36.htm#Message55
Rich
• Abstract
• Summary
• Rise In Atmospheric Carbon Dioxide
• Atmospheric And Surface Temperatures
• The Global Warming Hypothesis
• Global Warming Evidence
• Sea Levels And Storms
• Fertilization Of Plants
• Discussion
• References
--------------------------------------------------------------------------------
Top Previous Next
Abstract
Click here to receive this document in PDF format.
Click here to view this a slide show version of the figures and graphs
ARTHUR B. ROBINSON, SALLIE L. BALIUNAS, WILLIE SOON, AND ZACHARY W. ROBINSON
Oregon Institute of Science and Medicine, 2251 Dick George Rd., Cave Junction, Oregon 97523 info@oism.org
That is not at all correct. Do some research on the matter instead of believing the media. To whit:The capacity of plants to absorb CO2 is not unlimited. If it were, then we wouldn't have rising levels of CO2, but we do. The available energy from the sun, water and total biomass are all rate limiters. If CO2 levels became depleted only then would plant-life benefit from increased emissions.
George C. Marshall Institute, 1730 K St., NW, Ste 905, Washington, DC 20006 info@marshall.org January 1998
ABSTRACT
A review of the research literature concerning the environmental consequences of increased levels of atmospheric carbon dioxide leads to the conclusion that increases during the 20th Century have produced no deleterious effects upon global weather, climate, or temperature. Increased carbon dioxide has, however, markedly increased plant growth rates. Predictions of harmful climatic effects due to future increases in minor greenhouse gases like CO2 are in error and do not conform to current experimental knowledge.
http://www.oism.org/pproject/s33p36.htm#Message55
Fertilization Of Plants
How high will the carbon dioxide concentration of the atmosphere ultimately rise if mankind continues to use coal, oil, and natural gas? Since total current estimates of hydrocarbon reserves are approximately 2,000 times annual use (47), doubled human release could, over a thousand years, ultimately be 10,000 GT C or 25% of the amount now sequestered in the oceans. If 90% of this 10,000 GT C were absorbed by oceans and other reservoirs, atmospheric levels would approximately double, rising to about 600 parts per million. (This assumes that new technologies will not supplant the use of hydrocarbons during the next 1,000 years, a pessimistic estimate of technological advance.)
One reservoir that would moderate the increase is especially important. Plant life provides a large sink for CO2. Using current knowledge about the increased growth rates of plants and assuming a doubling of CO2 release as compared to current emissions, it has been estimated that atmospheric CO2 levels will rise by only about 300 ppm before leveling off (2). At that level, CO2 absorption by increased Earth biomass is able to absorb about 10 GT C per year.
Figure 17: Standard normal deviates of tree ring widths for (a) bristlecone pine, limber pine, and fox tail pine in the Great Basin of California, Nevada, and Arizona and (b) bristlecone pine in Colorado (48). The tree ring widths have been normalized so that their means are zero and deviations from the means are displayed in units of standard deviation.
As atmospheric CO2 increases, plant growth rates increase. Also, leaves lose less water as CO2 increases, so that plants are able to grow under drier conditions. Animal life, which depends upon plant life for food, increases proportionally.
Figures 17 to 22 show examples of experimentally measured increases in the growth of plants. These examples are representative of a very large research literature on this subject (49-55). Since plant response to CO2 fertilization is nearly linear with respect to CO2 concentration over a range of a few hundred ppm, as seen for example in figures 18 and 22, it is easy to normalize experimental measurements at different levels of CO2 enrichment. This has been done in figure 23 in order to illustrate some CO2 growth enhancements calculated for the atmospheric increase of about 80 ppm that has already taken place, and that expected from a projected total increase of 320 ppm.
As figure 17 shows, long-lived (1,000- to 2000-year-old) pine trees have shown a sharp increase in growth rate during the past half-century.
Rich
Member of the world's premier gun club, the USMC!
http://www.sourcewatch.org/wiki.phtml?t ... d_Medicine
Maybe you don't believe sourcewatch, it is liberally biased, after all.
Here's a few more things about the credibility of this research:
http://www.sciencecases.org/petition/petition.asp
http://www.fair.org/index.php?page=1682
That said, this study is a component of a politically motivated petition program. It's not even peer-reviewed, and has been discredited.
-
RACastanet
- Posts: 3744
- Joined: Thu Mar 11, 1999 6:01 am
- Location: Richmond, VA
This is hot off the presses Justin:
Two Decades of Northern Hemispheric Greening
--------------------------------------------------------------------------------
Reference
Piao, S., Friedlingstein, P., Ciais, P., Zhou, L. and Chen, A. 2006. Effect of climate and CO2 changes on the greening of the Northern Hemisphere over the past two decades. Geophysical Research Letters 33: 10.1029/2006GL028205.
Background
Piao et al. set the stage for their study by noting that "enhanced terrestrial vegetation growth in the middle and high latitudes of the Northern Hemisphere over the past two decades has been well documented (Zhou et al., 2001; Nemani et al., 2003)," but they report that "the mechanisms for this phenomenon are still under debate."
What was done
Using a leaf area index data set for the period 1981-2000, which was created from satellite-derived observations of the normalized difference vegetation index parameter for land areas above 25°N latitude, the authors investigated "spatial patterns of mechanisms controlling current enhanced vegetation growth in the Northern Hemisphere," focusing on "how recent changes in precipitation, temperature [and] atmospheric CO2 concentration have influenced vegetation growth."
What was learned
Over the final two decades of the 20th century, the researchers found the mean rate of increase in growing-season leaf area index to have been 0.0041/year, and that 13% of that increase was provided by increases in precipitation, 31% was provided by increases in temperature, and that fully 49% was provided by the increase in the atmosphere's CO2 concentration.
What it means
In response to what climate alarmists describe as unprecedented increases in the air's CO2 content and temperature, which they characterize as phenomena worse than nuclear warfare and global terrorism, the bulk of the terrestrial vegetation of the Northern Hemisphere north of 25°N has not only not suffered because of them, it has actually grown more robust.
References
Nemani, R.R., Keeling, C.D., Hashimoto, H., Jolly, W.M., Piper, S.C., Tucker, C.J., Myneni, R.B. and Running. S.W. 2003. Climate-driven increases in global terrestrial net primary production from 1982 to 1999. Science 300: 1560-1563.
Zhou, L., Tucker, C.J., Kaufmann, R.K., Slayback, D., Shabanov, N.V. and Myneni, R.B. 2001. Variations in northern vegetation activity inferred from satellite data of vegetation index during 1981-1999. Journal of Geophysical Research 106: 20,069-20,083.
Reviewed 14 March 2007
Member of the world's premier gun club, the USMC!
It was a mistake on my part to say that plants only benefit if the co2 level depletes, as it's not a true rate-limiting step. Enhanced plant growth may somewhat offset a co2 spike. Despite my overstatement error, the fact remains that CO2 levels continue to rise despite any increases in plant growth.
The central point I was trying to make is that our emissions are not nullified by natural processes. It cannot be assumed that the problem will go away on its own. Life is flexible and adapts over time, and in a million years our emissions levels will not have created a dead world or any such extravagance. But it does seem that our emissions levels are likely to cause us problems.
The central point I was trying to make is that our emissions are not nullified by natural processes. It cannot be assumed that the problem will go away on its own. Life is flexible and adapts over time, and in a million years our emissions levels will not have created a dead world or any such extravagance. But it does seem that our emissions levels are likely to cause us problems.
